
ASC 842 Lease Accounting May 7, 2019 Exhibit 99.2
FORWARD LOOKING STATEMENTS This presentation contains, or may be deemed to contain “forward-looking statements” within the meaning of the “Safe Harbor” provisions of the United States Private Securities Litigation Reform Act of 1995. Forward-looking statements are subject to risks and uncertainties that may cause Cinemark’s actual results to differ materially from the expectations indicated or implied by such statements. Such Risk Factors are set forth and expressly qualified in their entirety in the Company’s filings with the SEC, including the most recently filed Annual Report on Form 10-K. The Company undertakes no obligation to publicly update or revise any forward-looking statements. This presentation may include certain non-GAAP financial measures. A reconciliation of these non-GAAP measures to the most directly comparable financial measures calculated and presented in accordance with GAAP can be found within the Company’s most recently filed Annual Report on Form 10-K, on the Company’s website at www.investors.Cinemark.com, furnished on Form 8K filed 5/7/2019 and the Appendix of this presentation.
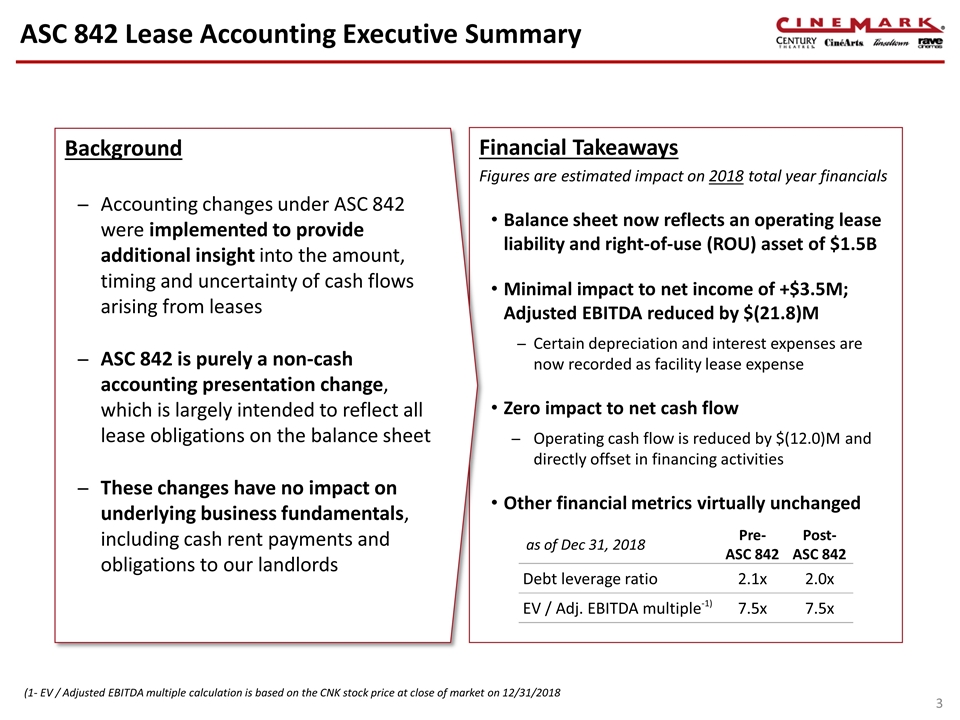
ASC 842 Lease Accounting Executive Summary Financial Takeaways Figures are estimated impact on 2018 total year financials Balance sheet now reflects an operating lease liability and right-of-use (ROU) asset of $1.5B Minimal impact to net income of +$3.5M; Adjusted EBITDA reduced by $(21.8)M Certain depreciation and interest expenses are now recorded as facility lease expense Zero impact to net cash flow Operating cash flow is reduced by $(12.0)M and directly offset in financing activities Other financial metrics virtually unchanged Background Accounting changes under ASC 842 were implemented to provide additional insight into the amount, timing and uncertainty of cash flows arising from leases ASC 842 is purely a non-cash accounting presentation change, which is largely intended to reflect all lease obligations on the balance sheet These changes have no impact on underlying business fundamentals, including cash rent payments and obligations to our landlords as of Dec 31, 2018 Pre- ASC 842 Post- ASC 842 Debt leverage ratio 2.1x 2.0x EV / Adj. EBITDA multiple-1) 7.5x 7.5x 3 (1- EV / Adjusted EBITDA multiple calculation is based on the CNK stock price at close of market on 12/31/2018
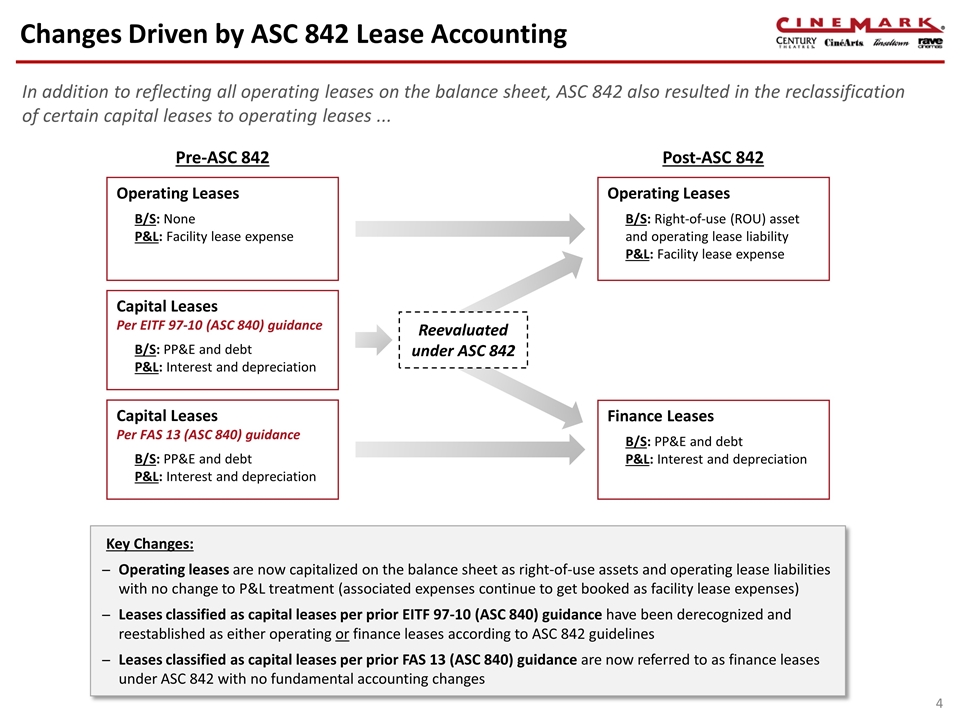
Changes Driven by ASC 842 Lease Accounting Operating Leases B/S: None P&L: Facility lease expense Capital Leases Per FAS 13 (ASC 840) guidance B/S: PP&E and debt P&L: Interest and depreciation Operating Leases B/S: Right-of-use (ROU) asset and operating lease liability P&L: Facility lease expense Finance Leases B/S: PP&E and debt P&L: Interest and depreciation In addition to reflecting all operating leases on the balance sheet, ASC 842 also resulted in the reclassification of certain capital leases to operating leases ... Reevaluated under ASC 842 Pre-ASC 842 Post-ASC 842 Key Changes: Operating leases are now capitalized on the balance sheet as right-of-use assets and operating lease liabilities with no change to P&L treatment (associated expenses continue to get booked as facility lease expenses) Leases classified as capital leases per prior EITF 97-10 (ASC 840) guidance have been derecognized and reestablished as either operating or finance leases according to ASC 842 guidelines Leases classified as capital leases per prior FAS 13 (ASC 840) guidance are now referred to as finance leases under ASC 842 with no fundamental accounting changes Capital Leases Per EITF 97-10 (ASC 840) guidance B/S: PP&E and debt P&L: Interest and depreciation
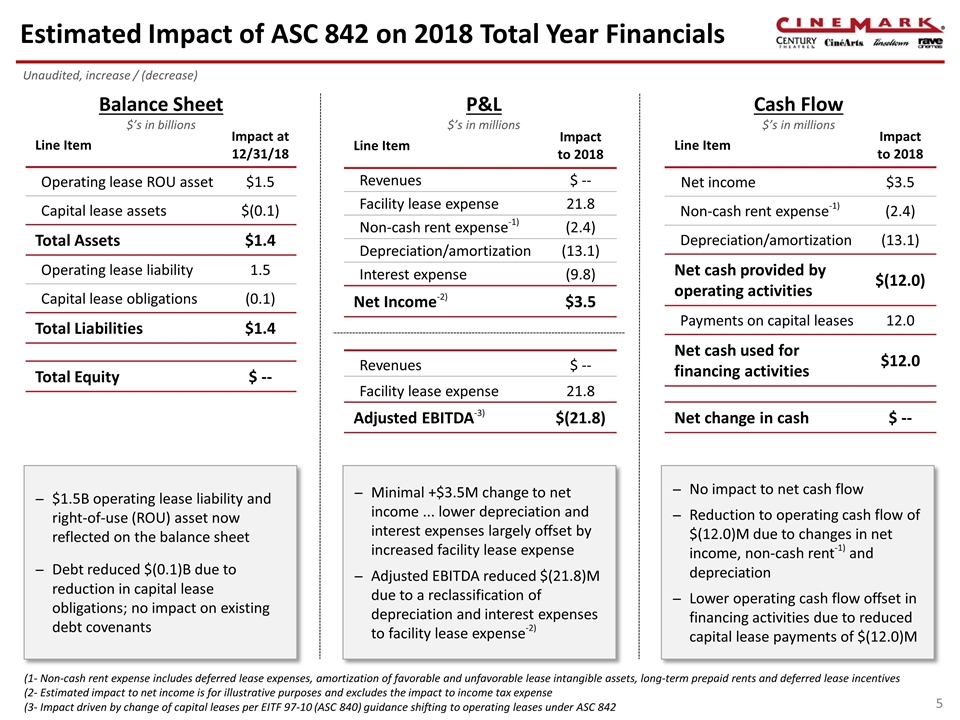
Estimated Impact of ASC 842 on 2018 Total Year Financials P&L $’s in millions Balance Sheet $’s in billions Cash Flow $’s in millions Minimal +$3.5M change to net income ... lower depreciation and interest expenses largely offset by increased facility lease expense Adjusted EBITDA reduced $(21.8)M due to a reclassification of depreciation and interest expenses to facility lease expense-2) $1.5B operating lease liability and right-of-use (ROU) asset now reflected on the balance sheet Debt reduced $(0.1)B due to reduction in capital lease obligations; no impact on existing debt covenants No impact to net cash flow Reduction to operating cash flow of $(12.0)M due to changes in net income, non-cash rent-1) and depreciation Lower operating cash flow offset in financing activities due to reduced capital lease payments of $(12.0)M Line Item Impact to 2018 Revenues $ -- Facility lease expense 21.8 Non-cash rent expense-1) (2.4) Depreciation/amortization (13.1) Interest expense (9.8) Net Income-2) $3.5 Line Item Impact at 12/31/18 Operating lease ROU asset $1.5 Capital lease assets $(0.1) Total Assets $1.4 Operating lease liability 1.5 Capital lease obligations (0.1) Total Liabilities $1.4 Total Equity $ -- Line Item Impact to 2018 Net income $3.5 Non-cash rent expense-1) (2.4) Depreciation/amortization (13.1) Net cash provided by operating activities $(12.0) Payments on capital leases 12.0 Net cash used for financing activities $12.0 Net change in cash $ -- Unaudited, increase / (decrease) (1- Non-cash rent expense includes deferred lease expenses, amortization of favorable and unfavorable lease intangible assets, long-term prepaid rents and deferred lease incentives (2- Estimated impact to net income is for illustrative purposes and excludes the impact to income tax expense (3- Impact driven by change of capital leases per EITF 97-10 (ASC 840) guidance shifting to operating leases under ASC 842 Revenues $ -- Facility lease expense 21.8 Adjusted EBITDA-3) $(21.8)
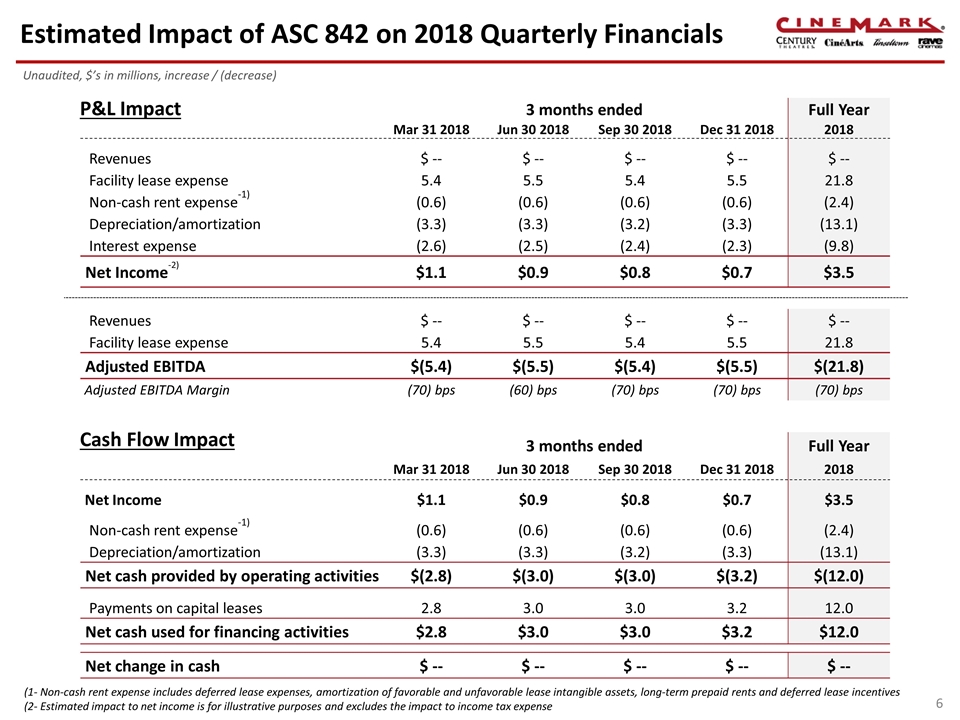
Estimated Impact of ASC 842 on 2018 Quarterly Financials 3 months ended Full Year Mar 31 2018 Jun 30 2018 Sep 30 2018 Dec 31 2018 2018 Revenues $ -- $ -- $ -- $ -- $ -- Facility lease expense 5.4 5.5 5.4 5.5 21.8 Non-cash rent expense-1) (0.6) (0.6) (0.6) (0.6) (2.4) Depreciation/amortization (3.3) (3.3) (3.2) (3.3) (13.1) Interest expense (2.6) (2.5) (2.4) (2.3) (9.8) Net Income-2) $1.1 $0.9 $0.8 $0.7 $3.5 Revenues $ -- $ -- $ -- $ -- $ -- Facility lease expense 5.4 5.5 5.4 5.5 21.8 Adjusted EBITDA $(5.4) $(5.5) $(5.4) $(5.5) $(21.8) Adjusted EBITDA Margin (70) bps (60) bps (70) bps (70) bps (70) bps 3 months ended Full Year Mar 31 2018 Jun 30 2018 Sep 30 2018 Dec 31 2018 2018 Net Income $1.1 $0.9 $0.8 $0.7 $3.5 Non-cash rent expense-1) (0.6) (0.6) (0.6) (0.6) (2.4) Depreciation/amortization (3.3) (3.3) (3.2) (3.3) (13.1) Net cash provided by operating activities $(2.8) $(3.0) $(3.0) $(3.2) $(12.0) Payments on capital leases 2.8 3.0 3.0 3.2 12.0 Net cash used for financing activities $2.8 $3.0 $3.0 $3.2 $12.0 Net change in cash $ -- $ -- $ -- $ -- $ -- (1- Non-cash rent expense includes deferred lease expenses, amortization of favorable and unfavorable lease intangible assets, long-term prepaid rents and deferred lease incentives (2- Estimated impact to net income is for illustrative purposes and excludes the impact to income tax expense P&L Impact Cash Flow Impact Unaudited, $’s in millions, increase / (decrease)
Appendix
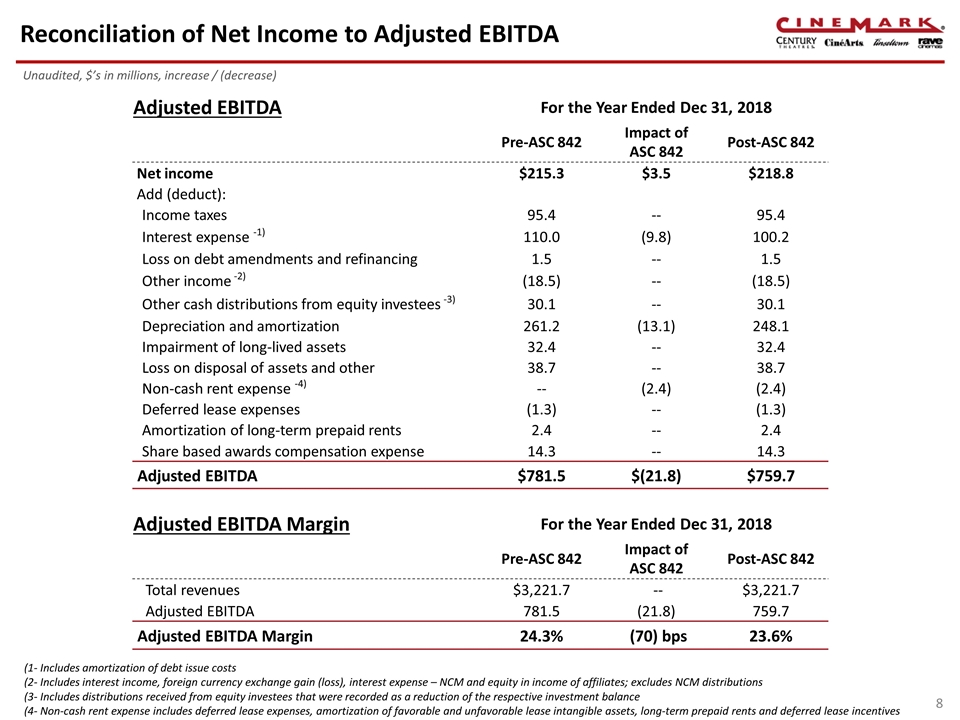
Reconciliation of Net Income to Adjusted EBITDA Unaudited, $’s in millions, increase / (decrease) Adjusted EBITDA For the Year Ended Dec 31, 2018 Pre-ASC 842 Impact of ASC 842 Post-ASC 842 Net income $215.3 $3.5 $218.8 Add (deduct): Income taxes 95.4 -- 95.4 Interest expense -1) 110.0 (9.8) 100.2 Loss on debt amendments and refinancing 1.5 -- 1.5 Other income -2) (18.5) -- (18.5) Other cash distributions from equity investees -3) 30.1 -- 30.1 Depreciation and amortization 261.2 (13.1) 248.1 Impairment of long-lived assets 32.4 -- 32.4 Loss on disposal of assets and other 38.7 -- 38.7 Non-cash rent expense -4) -- (2.4) (2.4) Deferred lease expenses (1.3) -- (1.3) Amortization of long-term prepaid rents 2.4 -- 2.4 Share based awards compensation expense 14.3 -- 14.3 Adjusted EBITDA $781.5 $(21.8) $759.7 Adjusted EBITDA Margin For the Year Ended Dec 31, 2018 Pre-ASC 842 Impact of ASC 842 Post-ASC 842 Total revenues $3,221.7 -- $3,221.7 Adjusted EBITDA 781.5 (21.8) 759.7 Adjusted EBITDA Margin 24.3% (70) bps 23.6% (1- Includes amortization of debt issue costs (2- Includes interest income, foreign currency exchange gain (loss), interest expense – NCM and equity in income of affiliates; excludes NCM distributions (3- Includes distributions received from equity investees that were recorded as a reduction of the respective investment balance (4- Non-cash rent expense includes deferred lease expenses, amortization of favorable and unfavorable lease intangible assets, long-term prepaid rents and deferred lease incentives
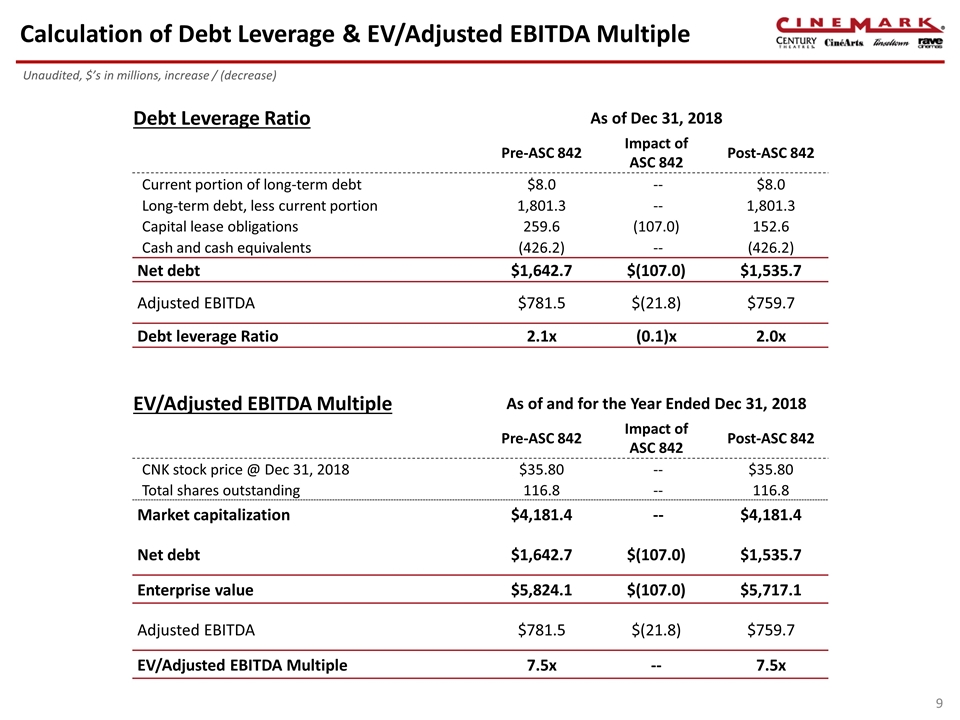
Calculation of Debt Leverage & EV/Adjusted EBITDA Multiple 9 Unaudited, $’s in millions, increase / (decrease) Debt Leverage Ratio As of Dec 31, 2018 Pre-ASC 842 Impact of ASC 842 Post-ASC 842 Current portion of long-term debt $8.0 -- $8.0 Long-term debt, less current portion 1,801.3 -- 1,801.3 Capital lease obligations 259.6 (107.0) 152.6 Cash and cash equivalents (426.2) -- (426.2) Net debt $1,642.7 $(107.0) $1,535.7 Adjusted EBITDA $781.5 $(21.8) $759.7 Debt leverage Ratio 2.1x (0.1)x 2.0x EV/Adjusted EBITDA Multiple As of and for the Year Ended Dec 31, 2018 Pre-ASC 842 Impact of ASC 842 Post-ASC 842 CNK stock price @ Dec 31, 2018 $35.80 -- $35.80 Total shares outstanding 116.8 -- 116.8 Market capitalization $4,181.4 -- $4,181.4 Net debt $1,642.7 $(107.0) $1,535.7 Enterprise value $5,824.1 $(107.0) $5,717.1 Adjusted EBITDA $781.5 $(21.8) $759.7 EV/Adjusted EBITDA Multiple 7.5x -- 7.5x